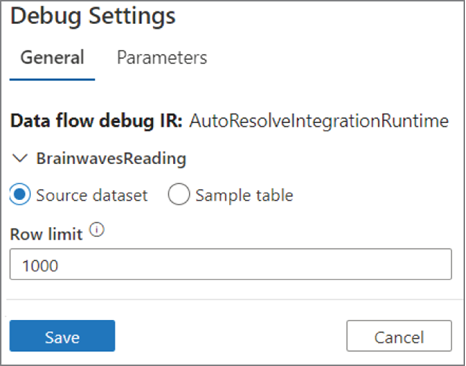
The pop‐out window enables you to select the integration runtime to use for the pipeline execution. Data flows often perform very large ingestion and transformational activities, and this additional amount of compute power is required to process them. The default amount of time to keep the IR active is 1 hour, but if you need a longer TTL, you can configure it for up to 4 hours. Note that you are charged for the consumption of the node, which is configured for the IR—in this case, Small, which is 4 (+ 4 driver cores). Once the Data Flow Debug option is enabled, it can be debugged during the pipeline execution and monitored on the Debug tab of the Pipeline Runs monitor (refer to Figure 9.10). Notice in Figure 10.12 that Data Flow Debug is enabled. You will also notice the Debug Settings button. When you click it, a pop‐out window appears (see Figure 10.22). The debug settings let you limit the number of rows to be returned, set parameters, and determine how the data is to be stored while debugging.

FIGURE 10.22 Troubleshooting a failed pipeline run: debug settings
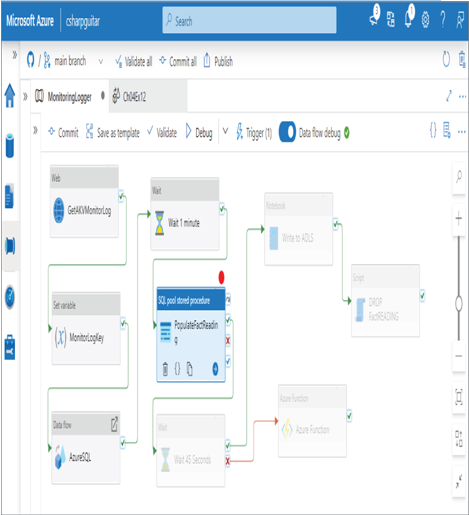
The next useful for debugging has to do with setting breakpoints. Breakpoints are flags, set at strategic locations along your pipeline, that instruct the pipeline execution engine to stop moving forward. This is a very useful tool, especially when you want to make sure the output of a previous activity is as expected before moving forward to perhaps a very long‐running data flow. In most of the figures in this book that show selected activities within a pipeline, you will notice a circle on the top right. That is where and how you set a breakpoint. When you click the circle, it will become solid, as shown in Figure 10.23.
This option is also referred to as the Debug Until feature. When the circle is selected, the pipeline will be executed until the breakpoint is hit. The pipeline execution shown in Figure 10.23 will process up to the PopulateFactReading SQL pool stored procedure activity. That activity will be executed but will stop progressing from that point. During the development or debugging process, you might encounter a scenario that unavoidably has a probability of failure. Managing the possibility of errors in a pipeline requires some form of error handling. The reason for handling (aka managing) errors is to prevent the pipeline from halting execution before completion. If pipeline execution stops before completion, the data may be only partially processed, leaving it in an undesired or unexpected state. Data in an unexpected format or timeframe can cause problems when you try to correct the error by running the pipeline again, thus potentially causing even more errors. This is why it is prudent to handle errors: so that the need to perform data cleansing due to errors can be avoided in the first place.

FIGURE 10.23 Troubleshooting a failed pipeline run: breakpoints

