It is almost certain that at some point while running your data analytics procedures, something unexpected will happen. When it does, you must gather information like the symptoms experienced and the log files that will help you get down to the reason for the behavior. Knowing what you read in the last section about the abundant variety of scenarios that lead to the complexity of provided relevant examples, you can rely on the stated forms of issues. Those forms are for exceptions, slowness, and availability.
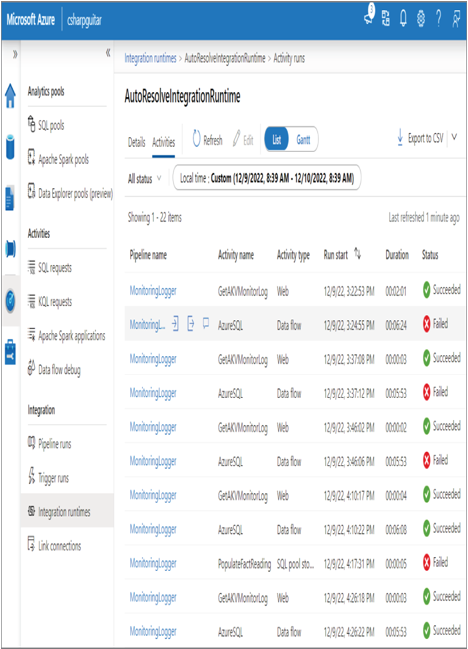
The initial location to begin troubleshooting a failed pipeline run is on the Monitor hub on your Azure Synapse Analytics workspace. Recall from Figure 9.10 that you can view the status of recent pipeline runs. A run with a status of Failed is a good indicator of an issue. Additionally, you can look at Figure 9.11, which will render the specific activity in the pipeline that failed. The perspectives in Figure 9.11 and Figure 10.18 will give you cross‐pipeline run visibility, which helps you find a single activity that is causing the problem. This is in contrast to looking at each pipeline run individually, as in Figure 9.10, and checking the activities from there.

FIGURE 10.18 Troubleshooting a failed pipeline run
Notice in Figure 10.18 that the issue with this pipeline has to do with the AzureSQL Data Flow activity. This pipeline was used in the Chapter 9 as an example, and you can see the AzureSQL activity in Figure 9.12. You can view the pipeline configuration file MonitoringLogger.json in the Chapter09 folder on GitHub. The AzureSQL activity is the data flow that was created in Exercise 4.13 and resembles Figure 4.38. The activity it performs is the ingestion of brain wave reading from an Azure SQL database to a temporary table that exists in a dedicated SQL pool. To find out the exception causing the AzureSQL activity to fail, hover over the line showing the failure and select the comment icon, as shown in Figure 10.18. In this scenario, the exception error code is DF‐Synapse‐DBNotExist, with summarized details provided here:
Job failed due to reason: at Sink ‘brainjammerTmpReading’: Cannot connect to SQL database: ‘jdbc:sqlserver://csharpguitar.sql.azuresynapse.net:1433;database={SQLPool}’, ‘Managed Identity (factory name): csharpguitar-synapse’.[SQL Exception]Error Code:40892, Error Message: Cannot connect to database when it is paused. ClientConnectionId:174263d3-d6da-427e-b146-5bd14cab0901, error stack:shaded.msdataflow.com.microsoft.sqlserver.jdbc.SQLServerException.makeFromDatabaseError(SQLServerException.java:265)
shaded.msdataflow.com.microsoft.sqlserver.jdbc.TDSTokenHandler.onEOF(tdsparser.java:300)
shaded.msdataflow.com.microsoft.sqlserver.jdbc.TDSParser.parse(tdsparser.java:133)
shaded.msdataflow.com.microsoft.sqlserver.jdbc.TDSParser.parse(tdsparser.java:37)
shaded.msdataflow.com.microsoft.sqlserver.jdbc.SQLServerConnection.sendLogon(SQLServerConnection.java:6295)
shaded.msdataflow.com.microsoft.sqlserver.jdbc.SQLServerConnection.logon(SQLServerConnection.java:4907)
shaded.msdataflow.com.microsoft.sqlserver.jdb
The reason for the exception is clear based on the provided error message, which states that a connection is not possible when the database is paused. In this scenario two databases are being used; therefore, you would need to check the connectivity to both and make sure they are both online. Once the resources are online, the pipeline can proceed to the next activity.
Identifying and troubleshooting slowness for optimization has been the main topic of this chapter. Any of the tuning and optimization techniques discussed so far can and should be applied to the product suffering from slowness. Using the many examples of performance metrics discussed in Chapter 9, the Duration column value from Figure 10.18, and the Gantt chart visualization of the pipeline run in Figure 9.22 will guide you to the point of slowness and contention. A point to call out here that was not mentioned in the previous section is that the level of logging that you have enabled can cause slowness. The higher the level of logging, the bigger impact on the performance of your pipeline. Figure 4.39 and Figure 5.40 show examples of a location to configure the logging level. The concept of verbosity was introduced in Chapter 3 and described in detail in Chapter 9 (refer to Table 9.1).

