Chapter 7 and Chapter 9 covered what you need to know for the exam concerning scaling. The intention of the content here is to summarize the three important concepts related to scaling. The first concept has to do with understanding the options you have regarding scaling an Azure Stream Analytics job. The second concept concerns the discovery and analysis of usage and performance metrics that identify when scaling is necessary. The last concept has to do with scaling itself, that is, how to scale specifically. Again, you should already have an idea about all three of these scaling aspects. If not, reread Chapter 7 and have a look over Chapter 9 where Azure Stream Analytics is discussed.
There are primarily two options for scaling an Azure Stream Analytics job: adding additional SUs and/or implementing and/or optimizing parallelization with partitions. An SU represents the amount of compute resources allocated to your job. The more SUs allocated to your job, the more CPU and memory the job can use. Partitioning is managed either by the platform, when in compatibility level 1.2 or greater, or by adding the PARTITION BY clause to your query. Every partition match resulting from the pattern following the PARTITION BY clause results in the data being divided into subsets. Each subset can be processed in parallel, which increases throughput. To determine when your job might benefit from scaling, you can use the following three metrics:
- SU % Utilization
- Watermark Delay
- Backlogged Events
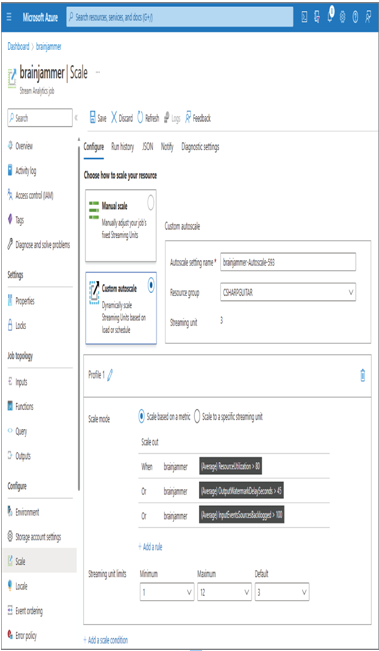
When SU % Utilization exceeds 80 percent and you notice an increase in the Watermark Delay and Backlogged Events numbers, that is a sign that you should increase the number of SUs allocated to the job. Refer to Figure 7.48, Figure 9.18, and Figure 9.19, which provide an example of Azure Stream Analytics usage and performance metrics. After determining that your job will benefit from additional SUs, you can scale manually, as shown in Figure 7.49, which allocates a static amount of compute resources to your job. The other option is to configure a custom autoscale rule, as shown in Figure 10.30.
Notice that the rule is based on the metrics identified earlier as those that are useful for identifying the need for adding SUs to the job. The numbers for the Watermark Delay and Backlogged Events metrics would need to be calculated using usage behaviors of the job over a longer time period. There also exists a throttle, which limits the maximum number of SUs to allocate, which is helpful for managing costs. Finally, in addition to adding SUs, consider reevaluating the way in which your incoming data is partitioned. If there is a structural change that can be made on the data producers that results in the addition of a partition id, then parallelization throughput can be realized, for example, including the electrode ID with the data stream and adding it to the PARTITION BY clause.

FIGURE 10.30 Scaling resources: custom autoscale rule

